…does not stop when the visual effects subside.
In order to make fireworks displays more interesting, chemicals are added to the propellant / powder mix. Igniting these mixtures produce varius incandescent and luminous effects during combustion. Byproducts from the chemical reactions that take place are areosols and a cocktail of more or less toxic gases.
Typical compounds that are found in the aerosols are:
Aluminium oxide, ammonium carbonate, Antimony(III) oxide, barium carbonate, barium sulphate, Bismuth(III) oxide, carbon, Copper(II) oxide, Iron(III) oxide, Magnesium oxide, potassium chloride, Potassium oxide, Potassium carbonate, Potassium nitrate, Potassium sulfate, Potassium sulfide, Potassium sulfite, Potassium thiocyanate, Strontium carbonate, Strontium sulfate, Sulphur, Titanium(II) oxide [1] - in order to name a few.
It’s not the kind of stuff I normally voluntarily would inhale into my lungs, but - being a layman, what do I know? If this stuff was dangerous, we wouldn’t be allowed to play around with fireworks, would we?
“The health effects of inhaling such a concentrated and complex chemical cocktail of different toxic substances in the form of micron sized particles remain unknown” [2]
Yet, we happily disperse these substances all over our local biosphere, in copious amounts, champagne bottle in hand, at a every new years celebration.
I have to admit, that I hadn’t really given this much thought, until one of my co-workers posted this image of the PM2.5 concenctrations from a NB-IoT environmental sensor that we had deployed in the city center in Trondheim, just before christmas. The location of the sensor is approximately 1 km inside the fireworks exclusion zone in the city and is located on the roof of a 5 story shopping mall.
Data from our test sensor:
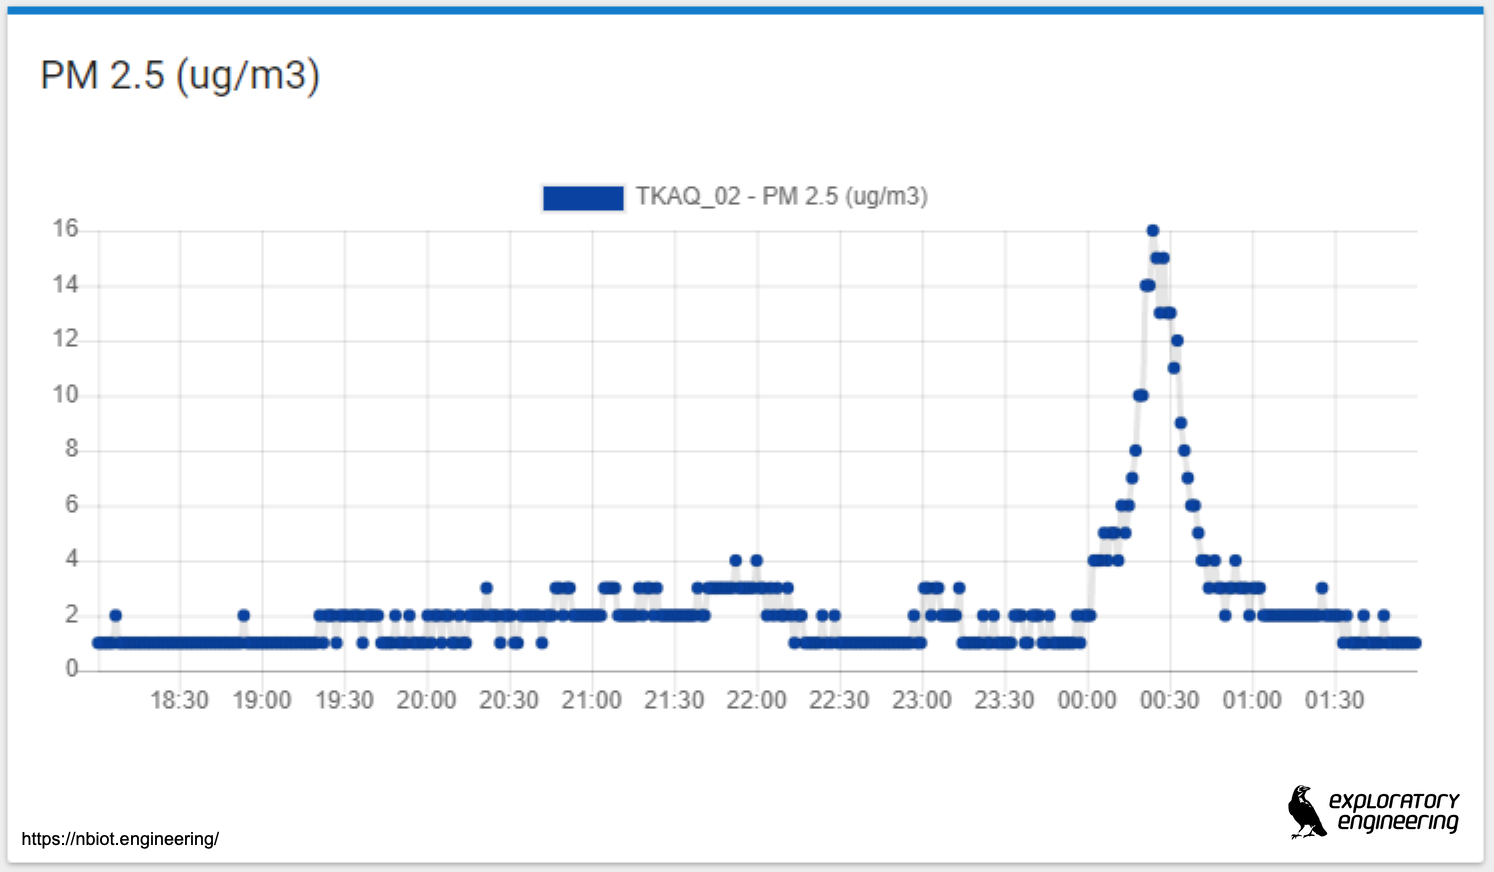 The graph displays raw data from an onboard Honewell particle sensor. This is a relatively inexpensive device that you can get from DigiKey.
We also plotted the PM10 curve from the same sensor. The curve shape seems identical to the PM2.5 curve, but with a slight concentration offset. I’m still not quite sure if this is because the particle distributions are the same or if the sensor manufacturer has resorted to “trickery” in order to estimate PM10 concentrations from a PM2.5 sensor.
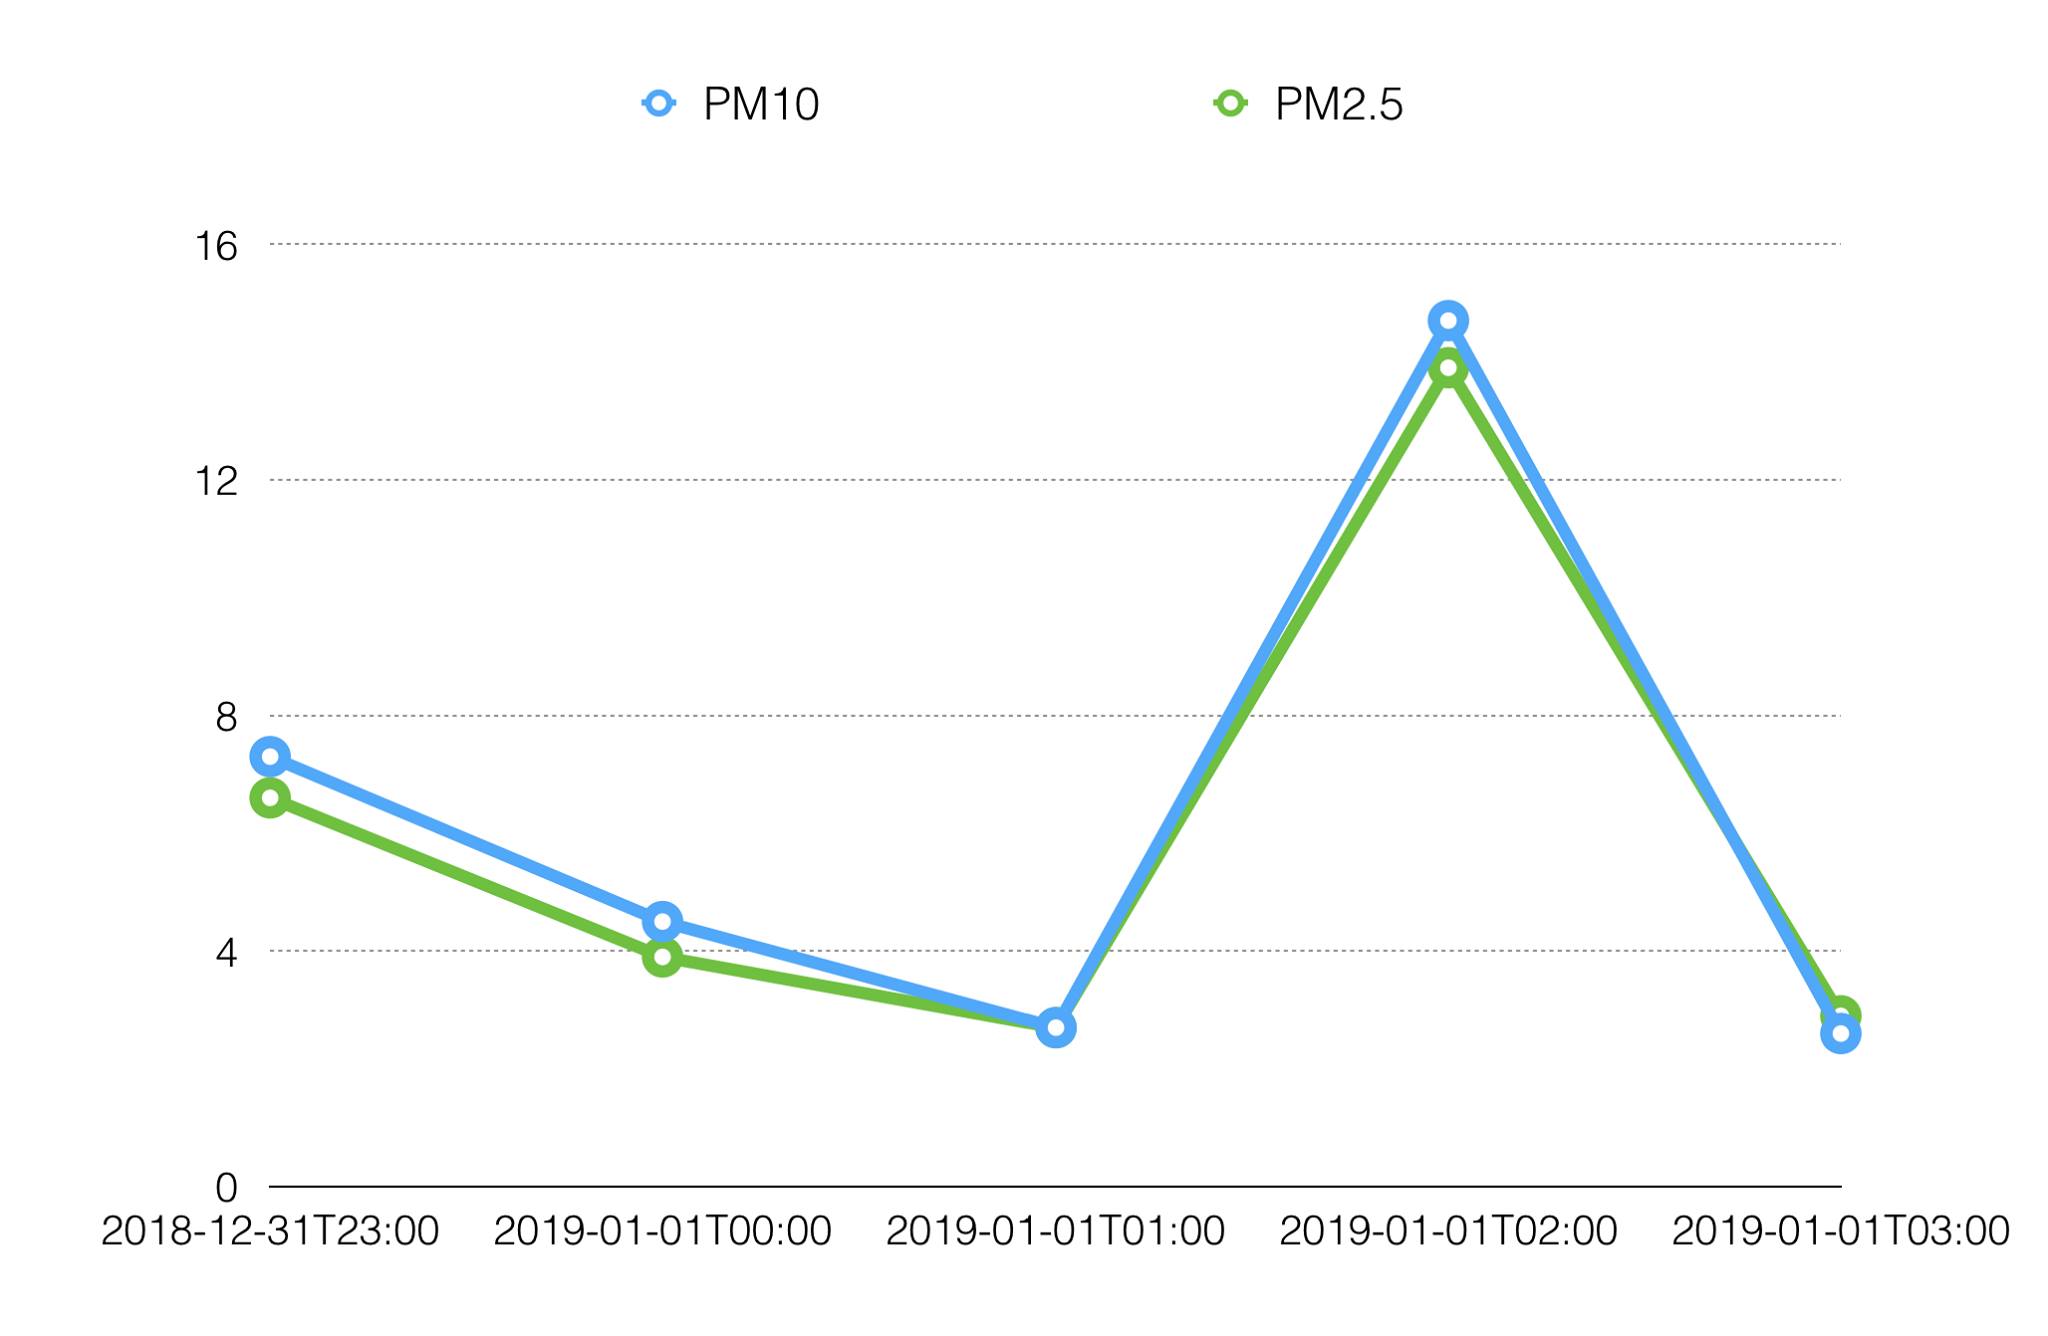
Still, it’s comforting to see the output from one of the data loggers belonging to the Norwegian Institute for Air Research. This sensor is at street level, at a distance approximately 1 km away from our sensor. This displays a similar peak in approximately the same time period.
Data from the NILU-sensor:
Of course, one has to be really careful when interpreting data. It’s easy to jump to conclusions. We may have observed the PM2.5 aerosols from the fireworks displays, or we may have observed the janitor on a smoking break in close proximity to the sensor.
There is also a time discrepancy between these graphs. I’m pretty sure that our timestamps are correct. We log raw sensor data, not moving averages. Maybe we’re observing a smoothing algorithm in the other graph? Maybe we haven’t observed fireworks fallout at all, but two separate smoking breaks? Further investigations will have to be made :)
References
[1] “Toxicity issues pertaining to burning pyrotechnics”, HAL 2014, Guy Marlair, Richard Turcotte, Queenie Kwok, Ruddy Branka
[2] “Effect of fireworks events on urban background trace metal aerosol concentrations: Is the cocktail worth the show?”, Journal of Hazardous Materials, 2010, Teresa Morenoa, Xavier Querol a, Andrés Alastueya, Fulvio Amatoa, Jorge Peya, Marco Pandolfia, Nino Kuenzli b, Laura Bousoc, Marcela Riverac, Wes Gibbons d,